- Home <
- Investor relations
Contacts
Marian van der Walt
Executive:
Corporate & Investor Relations
Telephone: +27 (0)11 411 2037
Fax: +27 (0)86 614 0999
Mobile: +27 (0)82 888 1242
E-mail: marian@harmony.co.za
Esha Brijmohan
Investor Relations Officer
Telephone: +27 (0)11 411 2314
Fax: +27 (0)11 692 3879
Mobile: +27(0)82 922 4584
E-mail: esha@harmony.co.za
This Annual Report, as well as the Sustainable Development Report, are available on request in printed format from Harmony’s Investor Relations team or in electronic format on the internet at www.harmony.co.za.
In addition, Harmony has produced the Form 20-F (PDF - 2.51MB) (a report required by the United States Securities and Exchange Commission, copies of which are also available from the end of October 2008, free of charge on EDGAR at www.sec.gov or from our website: www.harmony.co.za.
Stock exchange listings and ticker codes
Harmony’s primary listing is on the JSE Limited. The company’s shares are also listed on the stock exchanges in London, Paris and Berlin, and are quoted in the form of American Depositary Receipts (ADRs) on the New York and Nasdaq exchanges and as International Depositary Receipts (IDRs) on the Brussels exchange.
Harmony’s quoted share codes on these exchanges are as follows:
| JSE Limited | HAR |
| New York Stock Exchange and Nasdaq | HMY |
| London Stock Exchange | HRM |
| Euronext Brussels | HMY |
| Euronext Paris | HG |
| Berlin Stock Exchange | HAM1 |
Share price analysis
Overall, the Harmony share price rose during the course of the year, trading on the JSE between a low of R61.75 and a high of R115.00 per share during the 2008 financial year.
On the NYSE, the share traded between a low of US$8.48 and a high of US$15.19 per share. At the end of the financial year, the share price on the JSE and NYSE closed at R95.00 and US$12.25 per share, respectively. As at 30 June 2008, the resulting market capitalisation was R38.3 billion and US$4.9 billion respectively.
Share information
| Sector | Resources | |
| Sub-sector | Gold | |
| Nature of business | Harmony Gold Mining Company Limited and its subsidiaries are engaged in underground and open-pit gold mining, exploration and related activities in South Africa and Papua New Guinea. | |
| Issued share capital as at 30 June 2008 | 403 253 756 shares in issue | |
| Market capitalisation | ||
| JSE: | at 30 June 2008 | R38.31 billion |
| at 30 June 2007 | R39.92 billion | |
| NYSE: | at 30 June 2008 | US$4.90 billion |
| at 30 June 2007 | US$5.68 billion | |
| Share price statistics – FY08 | ||
| JSE: | 12-month high | R115.00 |
| 12-month low | R61.75 | |
| Closing price | R95.00 | |
| NYSE: | 12-month high | US$15.19 |
| 12-month low | US$8.48 | |
| Closing price | US$12.25 | |
| Free float | 100% | |
| ADR ratio | 1:1 | |
| Performance on JSE | ||
| Number of shares traded (millions) | 367 | |
| Percent of total issued shares | 91% | |
| Value of shares traded | R30.95 billion | |
| ADR performance | ||
| Number of ADRs traded (millions) | 639 | |
| Total number of ADRs outstanding (millions) | 105 | |
| Value of ADRs traded | US$7.27 billion | |
Shareholder spread
| Number of shareholders | % of shareholders | Number of shares held | % shares held | |
|---|---|---|---|---|
| Public | 13 211 | 99.99 | 339 420 294 | 84.03 |
| Non-public | 2 | 0.01 | 63 833 462 | 15.97 |
| Holding 10%+ | 1 | 0.01 | 63 632 922 | 15.92 |
| Share options scheme | 1 | 0.01 | 201 303 | 0.05 |
| Employees share trust | 1 | 0.01 | 200 540 | 0.05 |
| Totals | 13 213 | 100.00 | 403 253 756 | 100.00 |

Shareholder profile
As at 30 June 2008, a total of 403 253 756 shares or 100% of the total number of shares in issue were outstanding. The largest shareholder is Allan Gray Limited which had a holding of 18.62% (74 820 914 shares) at the end of June 2008.
In terms of non-institutional ownership, ARM Ltd controls 63 632 922 shares or 15.84% of the issued share capital.
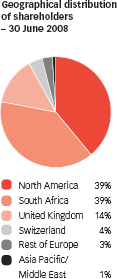
Our South African shareholder base increased from 34% to 39% for the year ended 30 June 2008. The combined institutional and retail ownership in the United States totalled 39% of Harmony's issued share capital. European ownership amounted to 21% of the shares outstanding, which included the 14% held by UK institutions.
Top 20 shareholders
| Shareholder | Combined | % holding of shares outstanding | |
|---|---|---|---|
| 1 | Allan Gray Ltd. | 74 820 914 | 18.62 |
| 2 | ARM Ltd | 63 632 922 | 15.84 |
| 3 | Blackrock Investment Management (UK) Ltd. | 33 298 000 | 8.29 |
| 4 | Orbis Investment Management Ltd. | 26 623 844 | 6.63 |
| 5 | Capital International, Inc. | 17 008 394 | 4.23 |
| 6 | Public Investment Commissioners | 11 418 906 | 2.84 |
| 7 | Sanlam Investment Management (Pty) Ltd. | 8 971 339 | 2.23 |
| 8 | Arnhold & S. Bleichroeder Advisers LLC | 8 924 358 | 2.22 |
| 9 | Soges Fiducem (IDRs) | 8 319 280 | 2.07 |
| 10 | Euroclear (French Listing) | 8 286 886 | 2.06 |
| 11 | Van Eck Global | 7 186 462 | 1.79 |
| 12 | Fidelity Management & Research | 6 889 706 | 1.71 |
| 13 | Investec Asset Management (South Africa) | 6 551 860 | 1.63 |
| 14 | Barclays Global Investors, N.A. | 6 108 397 | 1.52 |
| 15 | Capital Guardian Trust Co. | 5 862 469 | 1.46 |
| 16 | Dimensional Fund Advisors, Inc. | 5 846 152 | 1.46 |
| 17 | Old Mutual Asset Managers (Pty) Ltd. | 5 435 915 | 1.35 |
| 18 | State Street Global Advisors | 5 418 536 | 1.35 |
| 19 | Capital International S A | 5 143 186 | 1.28 |
| 20 | Capital World Investors | 5 119 710 | 1.27 |
Analysis of ordinary shares (Strate) as at 30 June 2008
| Shares held | Number of shareholders | % of shareholders | Number of shares held | % of issued share capital |
|---|---|---|---|---|
| 1 to 10 000 | 12 604 | 95.39 | 5 435 892 | 1.35 |
| 10 001 to 100 000 | 373 | 2.82 | 13 775 937 | 3.42 |
| 100 001 to 1 000 000 | 191 | 1.45 | 55 455 941 | 13.75 |
| over 1 000 000 | 45 | 0.34 | 328 585 986 | 81.48 |
| Total | 13 213 | 100.00 | 403 253 756 | 100.00 |
Historic performance of shares on the JSE
| FY08 | FY07 | FY06 | FY05 | FY04 | |
|---|---|---|---|---|---|
| As at 30 June: | |||||
| (R/share) | 95.00 | 100.27 | 114.10 | 58.25 | 65.25 |
| High (R/share) | 115.00 | 123.00 | 117.05 | 93.30 | 122.60 |
| Low (R/share) | 61.75 | 86.10 | 46.62 | 36.40 | 59.50 |
| Number of ordinary shares | |||||
| Issued (000) | 403 253 | 398 113 | 396 934 | 393 232 | 320 742 |
| Number of deals recorded | 293.682 | 183 004 | 148 746 | 85 487 | 87 918 |
| Volume of shares traded (000) | 367 286 | 323 417 | 351 555 | 303 414 | 279 660 |
| Volume of shares traded as % of total issued shares | 91.1 | 80.9 | 88.6 | 77.0 | 87.0 |
Currency conversion guide as at 30 June 2008 (R)
| 2008 | 2007 | 2006 | 2005 | |
|---|---|---|---|---|
| Australian dollar | 7.51 | 4.3029 | 6.0128 | 5.3080 |
| US dollar | 7.80 | 7.0379 | 7.2701 | 6.6670 |
Shareholders’ diary
| Financial year-end: | 30 June |
| Annual financial statements issued: | 20 October 2008 |
| Form 20-F issued : | 20 October 2008 |
| Annual general meeting: | 24 November 2008 |
The dates of our quarterly results announcements will be published on our website: www.harmony.co.za
© Harmony Annual Report 2008


