![Harmony [logo]](i/logo.png)
![Harmony [logo]](i/print_logo.png)

- Home <
- Business review <
- Review of operations <
- South Africa
In this section
South Africa
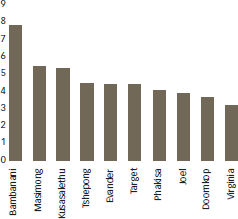
The South African operations include 10 underground mines and several surface operations that include Kalgold and the Phoenix project as well as assorted other surface operating entities. Its South African operations also house nine gold plants. Together these operations produced 1 367 372 ounces (42 530 kilograms)* of gold, at an average grade of 2.40g/t (FY09: 2.54g/t) – the average grade for the year for the underground operations was 4.54g/t (FY09: 4.64g/t) and for the surface operations, 0.41g/t (FY09: 0.40g/t). Given its importance in creating mining flexibility and improved operational productivity, ore reserve development continued to be a key area of focus.
During FY10, the group acquired the President Steyn 1 and 2 shafts, Lorainne 3 and the Free State 7 and 9 shafts, together with the President Steyn gold plant, collectively known as the Pamodzi Free State assets. Steyn 1 and 2 have been incorporated under the management of Bambanani, Lorraine 3 has been renamed Target 3 and incorporated under the management of the Target operation and Free State 7 and 9.
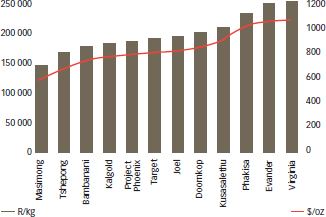
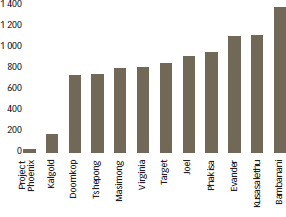
The average cash operating cost for these South African operations was R194 621/kg (US$799/oz) (FY09: R168 661/kg; US$583/oz) – increases of 15% and 37% respectively. Cost increases in dollar terms were aggravated by the strength of the rand. In terms of tonnes mined, costs were R467/tonne (US$56/ton) as compared to R428/tonne (US$43/ton) in FY09. These increases were driven largely by the escalating cost of electricity and labour as well as by the introduction of royalty payments from March 2010 in terms of the Mineral and Petroleum Resources Royalty Act.
Capital expenditure at the South Africa operations totalled R2.8 billion (US$371 million) as compared to R2.6 billion (US$289 million) the previous year. The increase in capital expenditure was due in large part to the equipping of the Steyn 2 shaft and shaft pillar arch at Bambanani east.
* Of this total South African production, 4 823 ounces (150 kilograms) were capitalised
Note: In the key statistics tables throughout this section, the term operating profit is comparable to the term production profit in the segment report, and not the operating profit line in the income statement.
South Africa – Cash operating costs
by operation

Total cash operating cost:R194 621/kg (US$799/oz)
(Exchange rate of US$1:R7.58)
South Africa – Cash operating costs (R/tonne)
by operation

Total cash operating cost per tonne:R467/per tonne (US$56/ton)
Project update
| Project | Phase | Milestones achieved in FY10 | Full production | Capital expenditure to date | Outstanding expenditure |
|---|---|---|---|---|---|
| Doornkop South Reef Project | Ramping up – production of 46 422 ounces in FY10 |
|
|
R1.47 billion | R294 million |
| Kusasalethu New Mine Project | Ramping up – production of 95 836 ounces in FY10 |
|
| R1 034 million | R77 million |
| Phakisa Project | Ramping up – production of 44 079 ounces in FY10 |
|
| R1.5 billion | R228 million |
| Tshepong Sub–71 decline Project | Development still in progress – first gold production scheduled for July 2012 |
|
| R133 million | R114 million |
South Africa – Grade (g/t)
by underground operation

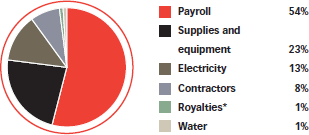
South Africa – breakdown of cash operating costs
FY10

* Royalty payments in line with the Mineral and Petroleum Resources Royalty Act came into effect in March 2010. It is estimated that these royalty payments will constitute 2% of total costs at the South African operations.
HARMONY ANNUAL REPORT 2010