![Harmony [logo]](i/logo.png)
![Harmony [logo]](i/print_logo.png)

- Home <
- Business review <
- Review of operations <
- South Africa <
- Phakisa
In this section
Phakisa
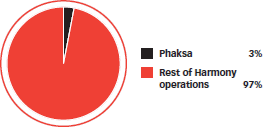
Contribution to group production – FY10


Description
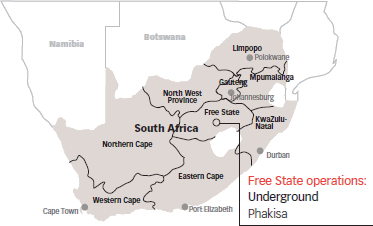
Phakisa mine, located in the Free State, mines the Basal Reef. Once the mine expansion project has been completed this mine will operate to a depth of some 2 400 metres and have a monthly capacity of 83 000 tonnes. Phakisa came into production in FY08. This operation includes the Nyala shaft, 5.5 kilometres away, which is used to hoist rock and is available as a second escape route. Ore mined at Phakisa is processed at Harmony 1 Plant, some 20 kilometres away.
Phakisa employed 3 034 in FY10, of which 2 858 were employees and 176 contractors. This is scheduled to increase to 3 181 people in FY11.
Detailed information on Phakisa’s resources and reserves are available in the Mineral resources and mineral reserves section of this annual report.
Safety
During FY10, Phakisa had three fatal accidents (FY09: no fatalities). Two fatalities were a result of a fall of ground in the development section and one was caused by a training accident. Post year-end, an explosion underground tragically resulted in five fatalities. The LTIFR for FY10 improved to 8.40 per million hours worked (FY09: 9.19).
More detailed information on safety performance and Harmony’s sustainable development concerns in South Africa can be found in the online Sustainable Development Report. A summary of this can be found under Harmony and sustainability.
| Production | FY10 | FY09 | FY08 | |
|---|---|---|---|---|
| Volumes milled | 000t (metric) | 339 | 185 | 31 |
| 000t (imperial) | 374 | 204 | 34 | |
| Gold produced | kg | 1 371 | 691 | 125 |
| oz | 44 079 | 22 216 | 4 024 | |
| Average grade | g/t | 4.04 | 3.74 | 4.04 |
| oz/t | 0.118 | 0.109 | 0.118 | |
| Financial | ||||
| Revenue | R million | 375 | 171 | 28 |
| US$ million | 50 | 19 | 4 | |
| Operating cost* | R/kg | 232 190 | 160 712 | 129 853 |
| US$/oz | 953 | 555 | 497 | |
| Operating profit | R million | 49 | 64 | 11 |
| US$ million | 7 | 7 | 2 | |
| Capital expenditure | R million | 486 | 461 | 293 |
| US$ million | 64 | 51 | 40 | |
| Sustainability | ||||
| Number of employees | ||||
| Employees | 2 858 | |||
| Contractors | 176 | |||
| Total | 3 034 | |||
| HDSAs in management** | % | 32 | ||
| Women in mining** | % | 11 | ||
| Expenditure on training and development | R million | 10 | ||
| Safety | ||||
| No. of fatalities | 3 | |||
| LTIFR | per million hours worked | 8.40 | ||
| Environment | ||||
| Energy used | 000MWh | 67 | ||
| Water used for primary activities | 000m3 | 408 | ||
| GHG emissions | 000t CO2e | 81 | ||
| Expenditure on local economic development | R million | 2 | ||
| Status of mining right | New order mining right granted in December 2007 | |||
* Includes royalty payment in FY10
** Indicator reported in terms of the MPRDA and the South African Mining Charter
Operations review
Milled volumes increased by 83% year-on-year. This together with an 8% improvement in the grade mined contributed to a 98% increase in gold produced to 44 079 ounces.
The increase in volumes was in line with the build-up in production currently under way. Plans are still on track to attain monthly production capacity of 83 000 tonnes by FY13. The build-up was affected by geological issues, illegal mining activities and down-time on the new infrastructure. The rail-veyor infrastructure necessary for full production was completed and the third rail-veyor was commissioned in December 2009. Implementation of phase 1 was concluded with the replacement of the original skips and cages by an eight-tonne skip and a detachable cage. Fine-tuning of this infrastructure and of the ice plants and rock handling systems in particular, continued. The five ice plants were found to be underperforming and the original equipment manufacturers have been engaged to assist with remedial action and to advise on ways of improving performance.
Mining was also undertaken at the Nyala shaft where payable pillars are available for mining. For FY10, 32% of total combined Phakisa/Nyala production came from Nyala.
Since it is a new mine, development at Phakisa is currently centred close to the shaft in the lower grade southern areas. The major drive is on development of the area to the north to access higher grade areas and to move closer to the average reserve grade. Grades will improve as development progresses towards the north and more reef is exposed within the major north-west to south-east trending Basal Reef payshoot. A steep build-up in production is planned, building up to annual production of more than 1Mt a year at an average grade of 7.94g/t and yielding around 270 000oz.
Financial review
Revenue for the year rose by 119% to R375 million, boosted by the increase in production and the higher gold price received. In dollar terms, revenue was up 163% to US$49 million. Costs increased as a result of production build up costs as well as the cost of employees transferred from shafts that had been closed to Phakisa. With the transition from project phase into production, a portion of Phakisa’s commissioning costs were capitalised. Cash operating costs in rands increased by 44% to R232 190/kg and were 72% up in dollar terms to $953/oz.
Capital expenditure for the year was R486 million ($64 million), the bulk of which was spent on the expansion project as well as on on-going development and the maintenance of major equipment.
Outlook*
As the mine continues with its build-up to full production and given greater flexibility and availability of face length, the grade at Phakisa is expected to improve further in FY11. The mine is on track to attain full production during FY13. The average grade mined should increase from FY12 onwards when mining is scheduled to move into the higher-grade north areas.
Volumes milled will continue to increase in FY11, rising to 563 470 tonnes, while the grade is expected to average approximately 4.2g/t. Gold production of 2 350 kilograms (75 555 ounces) is planned for FY11 at a cash cost** of R242 080/kg (US$987/oz). Cash costs should decline once this operation has reached full production.
Planned capital expenditure** for FY11 is R391 million (US$51 million). Of this, R182 million (US$24 million) will be spent on on-going development and R44 million (US$6 million) on major equipment maintenance and other shaft capital. Capital planned for the major project is R165 million (US$22 million).
Current productivity levels of 46g/TEC are forecast to improve to an annual average of 224g/TEC during peak production.
* Please refer to the forward-looking statements
** June 2010 money terms. The exchange rate of R7.63/US$ as at 30 June 2010 has been used for all forward-looking conversions.
HARMONY ANNUAL REPORT 2010